The Facts
Director’s Note:
The science and research done on the true impacts of animal agriculture is always growing. The statistics used in the film were based on the best information we had available while producing the film. We will continually update this list with further resources as they become available
- GREENHOUSE GASES -
Animal agriculture is responsible for 18 percent of greenhouse gas emissions, more than the combined exhaust from all transportation. [i]
Transportation exhaust is responsible for 13% of all greenhouse gas emissions. [.i]
Greenhouse gas emissions from this sector primarily involve fossil fuels burned for road, rail, air, and marine transportation.
Environmental Protection Agency. "Global Greenhouse Gas Emissions Data".
Livestock and their byproducts account for at least 32,000 million tons of carbon dioxide (CO2) per year, or 51% of all worldwide greenhouse gas emissions.
Goodland, R Anhang, J. “Livestock and Climate Change: What if the key actors in climate change were pigs, chickens and cows?”
Methane is 25-100 times more destructive than CO2 on a 20 year time frame.
Methane has a global warming potential 86 times that of CO2 on a 20 year time frame.
Livestock is responsible for 65% of all human-related emissions of nitrous oxide – a greenhouse gas with 296 times the global warming potential of carbon dioxide, and which stays in the atmosphere for 150 years.
"Livestock' Long Shadow: environmental issues and options". FAO. Rome. 2006
Emissions for agriculture projected to increase 80% by 2050.
Energy related emissions expected to increase 20% by 2040.
"Carbon Dioxide Emissions to 2040". Energy Global. 06 January 2015
"World Energy Outlook 2014 Factsheet". International Energy Agency.
"International Energy Outlook 2016". U.S. Energy Information. May 11, 2016
US Methane emissions from livestock and natural gas are nearly equal.
"Overview of Greenhouse Gases". United States Environmental Protection Agency.
"Key facts and findings. By the numbers: GHG emissions by livestock". FAO. (New)
Cows produce 150 billion gallons of methane per day. [xi]
250-500 liters per cow per day, x 1.5 billion cows globally is 99 - 198.1 billion gallons. Rough average of 150 billion gallons CH4 globally per day.
Converting to wind and solar power will take 20+ years and roughly 43 trillion dollars.
Even without fossil fuels, we will exceed our 565 gigatonnes CO2e limit by 2030, all from raising animals.
Oppenlander, Richard A. Food Choice and Sustainability: Why Buying Local, Eating Less Meat, and Taking Baby Steps Won’t Work. . Minneapolis, MN : Langdon Street, 2013. Print.
Source: calculation is based on http://www.worldwatch.org/node/6294 analyses that 51% of GHG are attributed to animal ag.
Reducing methane emissions would create tangible benefits almost immediately.
- WATER -
Fracking (hydraulic fracturing) water use ranges from 70-140 billion gallons annually.
Animal agriculture water consumption ranges from 34-76 trillion gallons annually. [ii] [xv]
"Summary of Estimated Water Use in the United States in 2005". United States Geological Service
Agriculture is responsible for 80-90% of US water consumption. [xv]
"How Important is Irrigation to U.S. Agriculture?" USDA: Economic Research Service. 12 October, 2016
Growing feed crops for livestock consumes 56% of water in the US. [xv]
Jacobson, Michael F. “Six Arguments For a Greener Diet: How a More Plant-based Diet Could Save Your Health and the Environment. Chapter 4: More and Cleaner Water”. Washington, DC: Center for Science in the Public Interest, 2006.
Californians use 1500 gallons of water per person per day. Close to Half is associated with meat and dairy products.
Fulton, Julian, et al. "California's Water Footprint". Pacific Institute. December 2012
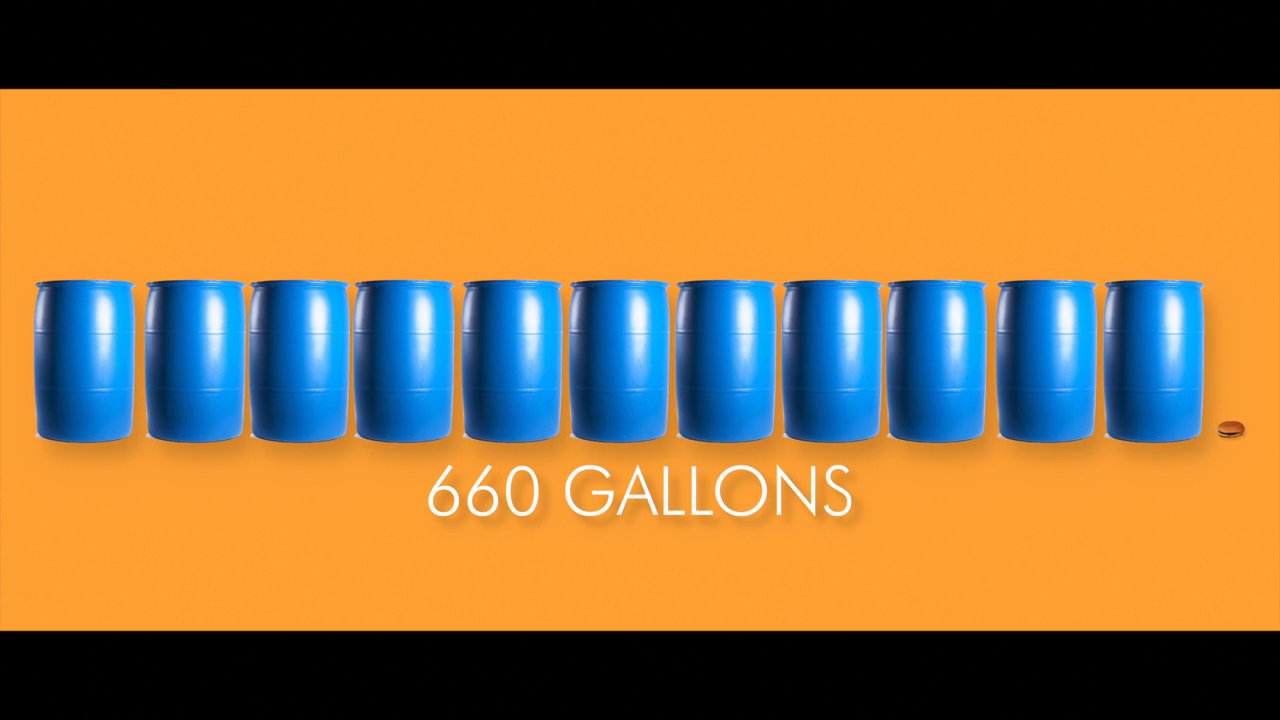
2,500 gallons of water are needed to produce 1 pound of beef.
(NOTE. The amount of water used to produce 1lb. of beef vary greatly from 442 - 8000 gallons. We choose to use in the film the widely cited conservative number of 2500 gallons per pound of US beef from Dr. George Borgstrom, Chairman of Food Science and Human Nutrition Dept of College of Agriculture and Natural Resources, Michigan State University, "Impacts on Demand for and Quality of land and Water." )
Robbins, John. "2,500 gallons all wet?" Earth Save: Healthy People Healthy Planet.
"Water Content of Things: Data Table 19". The World's Water 2008-2009
"Water". Environmental Working Group.
"Water footprint of crop and animal products: a comparison". Water Footprint Network. (New)
Oppenlander, Richard A. Food Choice and Sustainability: Why Buying Local, Eating Less Meat, and Taking Baby Steps Won’t Work. Minneapolis, MN: Langdon Street, 2013. Print
477 gallons of water are required to produce 1lb. of eggs; almost 900 gallons of water are needed for 1lb. of cheese.
"Water". Environmental Working Group.
"Food Facts: How Much Water Does it Take to Produce...?" Water Education Foundation. (New)
1,000 gallons of water are required to produce 1 gallon of milk.
Hoekstra, Arjen Y. "The water footprint of food". Water for Food.
5% of water consumed in the US is by private homes. 55% of water consumed in the US is for animal agriculture. [xv]
Jacobson, Michael F. “Six Arguments For a Greener Diet: How a More Plant-based Diet Could Save Your Health and the Environment. Chapter 4: More and Cleaner Water”. Washington, DC: Center for Science in the Public Interest, 2006.
Animal Agriculture is responsible for 20%-33% of all fresh water consumption in the world today.
- LAND -
Livestock or livestock feed occupies 1/3 of the earth’s ice-free land.
"Livestock a major threat to environment. Remedies urgently needed". FAO Newsroom. 29 November 2006
Livestock covers 45% of the earth’s total land.
Animal agriculture is the leading cause of species extinction, ocean dead zones, water pollution, and habitat destruction. [xix] [iv]
Animal agriculture contributes to species extinction in many ways. In addition to the monumental habitat destruction caused by clearing forests and converting land to grow feed crops and for animal grazing, predators and "competition" species are frequently targeted and hunted because of a perceived threat to livestock profits. The widespread use of pesticides, herbicides and chemical fertilizers used in the production of feed crops often interferes with the reproductive systems of animals and poison waterways. The overexploitation of wild species through commercial fishing, bushmeat trade as well as animal agriculture’s impact on climate change, all contribute to global depletion of species and resources. [XIX]
"What is a dead zone?" National Oceanic and Atmospheric Administration
"What Causes Ocean 'Dead Zones'?" Scientific American
"Nutrient Pollution: The Problem". Environmental Protection Agency
"Livestock's Long Shadow". Food and Agriculture Organization of The United Nations. 2006
Hogan, C Michael. "Causes of Extinction". The Encyclopedia of Earth. June 13, 2014
"Impact of habitat loss on species". WWF Global
"Risk Management Evaluation for Concentrated Animal Feeding Operations". U.S. Environmental Protection Agency. 2004Hance, Jeremy. "How humans are driving the sixth mass extinction". The Guardian. 20 October 2015 (New)
Livestock operations on land have created more than 500 nitrogen flooded deadzones around the world in our oceans.
Largest mass extinction in 65 million years.
Eldredge, Niles. "The Sixth Extinction". ActionBioscince. June 2001
"Mass extinction of species has begun". Phys.org. February 23, 2006
2-5 acres of land are used per cow.
Oppenlander, Richard A. Food Choice and Sustainability: Why Buying Local, Eating Less Meat, and Taking Baby Steps Won’t Work.
Minneapolis, MN: Langdon Street, 2013. Print.
Nearly half of the contiguous US is devoted to animal agriculture.
The US lower 48 states represents 1.9 billion acres. Of that 1.9 billion acres: 778 million acres of private land are used for livestock grazing (forest grazing, pasture grazing, and crop grazing), 345 million acres for feed crops, 230 million acres of public land are used for grazing livestock.
1/3 of the planet is desertified, with livestock as the leading driver. [xviii]
"UN launches International Year of Deserts and Desertification". UN News Centre. 1 January 2006
Oppenlander, Richard A. Less Meat, and Taking Baby Steps Won’t Work. Minneapolis, MN : Langdon Street, 2013. Print.
Hogan, C Michael. "Overgrazing". The Encyclopedia of Earth. May 1, 2010
- WASTE -
Every minute, 7 million pounds of excrement are produced by animals raised for food in the US.
This doesn’t include the animals raised outside of USDA jurisdiction or in backyards, or the billions of fish raised in aquaculture settings in the US. [v]
"Agricultural Waste Characteristics". Agricultural Waste Management Field Handbook. USDA. Chapter 4
A farm with 2,500 dairy cows produces the same amount of waste as a city of 411,000 people. [vi]
130 times more animal waste than human waste is produced in the US – 1.4 billion tons from the meat industry annually. 5 tons of animal waste is produced per person in the US. [xii]
"Animal Agriculture: Waste Management Practices". United States General Accounting Office. July 1999
In the U.S. livestock produce 116,000 lbs of waste per second:
-Dairy Cows, 120 lbs. of waste per day x 9.32 million dairy cows
-Cows, 63 lbs. of waste per day x 83.68 million cows
-Calves, 30 lbs. of waste per day x 34.3 million calves
-Pigs, 14 lbs. of waste per day x 74 million pigs
-Sheep and Goats, 5 lbs. of waste per day x 7.84 million sheep and goats
-Turkeys, .87 lbs. of waster per day x 77 million turkeys
-Broiler Chickens, .50 lbs. of waste per day x 1.74 billion broiler chickens
-Laying Hens, .25 lbs. of waster per day x 350.7 million laying hens
*pigs are raised twice per year, (a total of 148.3 million per year) so on any given day in the United States there are about 74 million pigs.
*turkeys are raised three times per year (a total of 233 million per year) so on any given day in the United States there are 77 million turkeys.
*broiler chickens are raised 5 times per year, (a total of 8.69 billion per year) so any given day there are1.74 billion broiler chickens.
Dairy Cows produce (120 lbs. x 9.32 m.) = 1.1184 billion lbs.
Cows produce (63 lbs. x 83.68 m.) = 5.27184 billion lbs.
Calves produce (30 lbs. x 34.3 m.) = 1.029 billion lbs.
Pigs produce (14 lbs. x 74.0 m.) = 1.036 billion lbs.
Sheep and Goats produce (5 lbs. x 7.84 m.) = 39.2 million lbs.
Turkeys produce (.87 lbs. x 77.0 m.) = 66.99 million lbs.
Broiler Chickens produce (.5 x 1.74 b.) = 870 million lbs.
Laying Hens produce (.25 x 350.7 m.) = 87.675 million lbs.
*Total manure produced in one day is 9.519105 billion lbs.
*Total manure produced in one year is 3.475 trillion lbs.
*This is the equivalent of over 6.611 million lbs. per minute. (This does not include any animal raised outside of USDA Jurisdiction, backyards or fish raised for aquaculture)
Animals produce Enough waste to cover SF, NYC, Tokyo, etc,
based off 1lb of waste per 1sqft at 1.4 billion tons.
*Total manure produced in one year is 3.475 trillion lbs. (From above calculation.)
US Livestock produce 335 million tons of “dry matter” per year.
- OCEANS -
3/4 of the world’s fisheries are exploited or depleted.
"Overfishing: a threat to marine biodiversity". United Nations Environment Programme
"General situation of world fish stocks". United Nations Food and Agriculture Organization
We could see fishless oceans by 2048.
Worm, Boris, et al. "Impacts of Biodiversity Loss on Ocean Ecosystem Services". Science. Vol 314. 3 November 2006
Roach, John. "Seafood May Be Gone by 2048, Study Says". National Geographic News. November 2, 2006
Montaigne, Fen. "Still Waters: The Global Fish Crisis". National Geographic
90-100 million tons of fish are pulled from our oceans each year. [vii]
As many as 2.7 trillion animals are pulled from the ocean each year.
Mood, A & Brooke, P. "Estimating the Number of Fish Caught in Global Fishing Each Year". July 2010
"Fish count estimates". Fishcount.org.uk
For every 1 pound of fish caught, up to 5 pounds of unintended marine species are caught and discarded as by-kill. [viii]
"Discard and bycatch in Shrimp trawl fisheries". FAO: Fisheries and Aquaculture Department
As many as 40% (63 billion pounds) of fish caught globally every year are discarded.
Keledjian, Amanda, et al. "Wasted Catch: Unsolved Problems in U.S. Fisheries". Oceana. March 2014
Goldenberg, Suzanne. "America's nine most wasteful fisheries named". The Guardian. 20 March 2014
Scientists estimate as many as 650,000 whales, dolphins and seals are killed every year by fishing vessels.
Keledjian, Amanda, et al. "Wasted Catch: Unsolved Problems in U.S. Fisheries". Oceana. March 2014
Goldenberg, Suzanne. "America's nine most wasteful fisheries named". The Guardian. 20 March 2014
Fish catch peaks at 85 million tons.
"World Review of Fisheries and Aquaculture: Part 1". UN: Food and Argriculture Organization. 2012
40-50 million sharks killed in fishing lines and nets.
"Shark Fin Trade Myths and Truths: BYCATCH". Shark Savers
"Sharks at Risk". Animal Welfare Institute
- RAINFOREST -
Animal agriculture is responsible for up to 91% of Amazon destruction.
Oppenlander, Richard A. Food Choice and Sustainability: Why Buying Local, Eating Less Meat, and Taking Baby Steps Won’t Work. . Minneapolis, MN : Langdon Street, 2013. Print.
1-2 acres of rainforest are cleared every second.
"Measuring the Daily Destruction of the World's Rainforests". Scientific American (New)
Butler, Rhett. "10 Rainforest Facts for 2017". Mongabay.com. January, 2017 (New)
"Avoiding Unsustainable Rainforest Wood". Rainforest Relief
"Tropical Deforestation". National Aeronautics and Space Administration: Facts
The leading causes of rainforest destruction are livestock and feedcrops.
Butler, Rhett. "Cattle Ranching's Impact on the Rainforest". Mongabay.com. July 2012 (New)
Up to 137 plant, animal and insect species are lost every day due to rainforest destruction.
"The Disappearing Rainforests". Save the Amazon.org
"What is Deforestation?" Kids.Mongabay.com
26 million rainforest acres (10.8m hectares) have been cleared for palm oil production. [ix]
136 million rainforest acres cleared for animal agriculture.
Butler, Rhett. "Amazon Destruction". Mongabay.com. January 2017
1,100 Land activists have been killed in Brazil in the past 20 years. [x]
Butler, Rhett A. "20 years ago the Amazon lost its strongest advocate". Mongabay. December 2008
Nuwer, Rachel. "The Rising Murder Count of Environmental Activists". The New York Times. June 2016 (New)
Further reading on Sister Dorothy Stang.
"About Sister Dorothy Stang". Sister of Notre Dame de Namur
- Wildlife -
USDA predator killing of wild animals to protect livestock.
"The USDA's War on Wildlife". Predator Defense
Washington state killed the wedge pack of wolves.
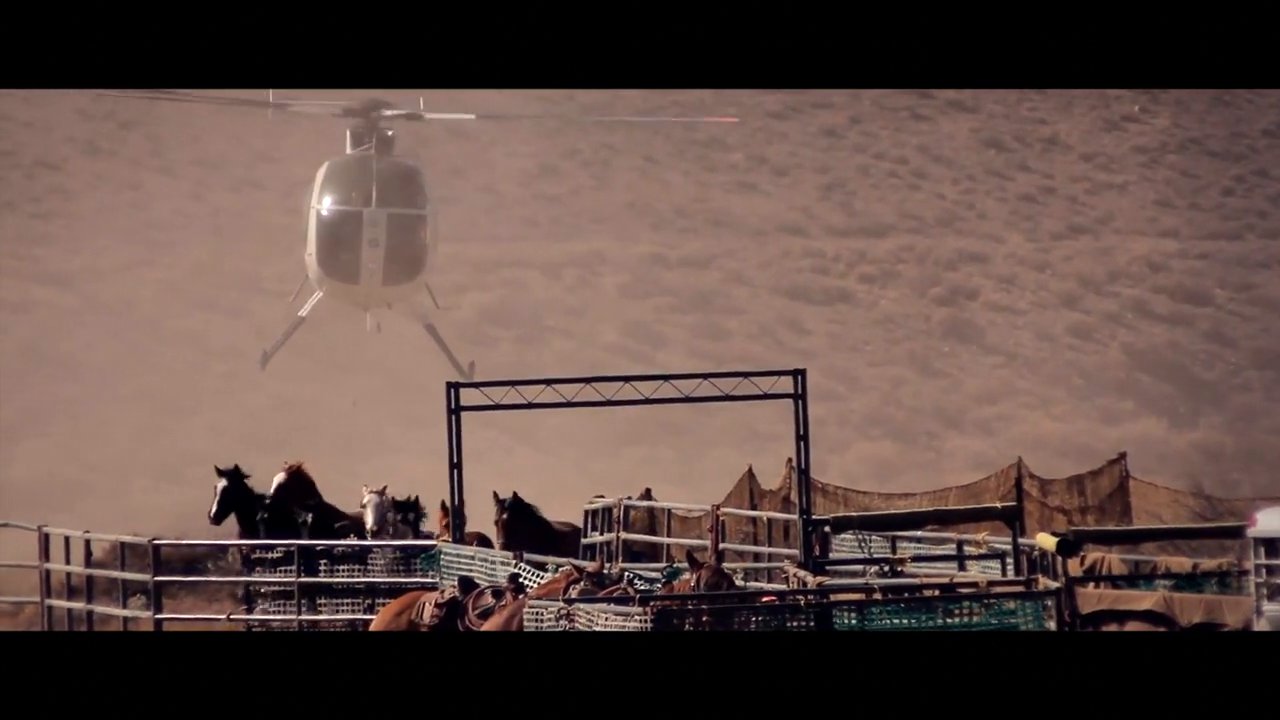
More wild horses and burros in government holding facilities than are free on the range.
"Program Data: On Range Population Estimates as of March 1, 2016". Bureau of Land Management
Ten thousand years ago, 99% of biomass (i.e. zoomass) was wild animals. Today, humans and the animals that we raise as food make up 98% of the zoomass.
Ede, Sharon. "The Bomb is Still Ticking...". Post growth: From bigger towards better. November 2010
Smil, Vaclav. "Harvesting the Biosphere: The Human Impact".
Population and Development Review 37 (4): 613-636 (December 2011)
- HUMANITY -
414 billion dollars in externalized cost from animal ag. [xvi]
80% of antibiotic sold in the US are for livestock.
Zuraw, Lydia. "2015 in Review: Animal Antibiotics". Food Safety News. December 2015 (New)
World population in 1812: 1 billion; 1912: 1.5 billion; 2012: 7 billion.
"Human Numbers Through Time". Nova
"Current World Population". Worldometers
70 billion farmed animals are reared annually worldwide. More than 6 million animals are killed for food every hour.
"Factory Farms". A Well Fed World
"Strategic Plan 2013-2017: For Kinder, Fairer Farming Worldwide". Compassion in World Farming
"Animals Slaughtered". Animals Deserve Absolute Protection Today and Tomorrow
Oppenlander, Richard A.Food Choices and Sustainability: Why Buying Local, Eating Less Meat, and Taking Baby Steps Won’t Work. Minneapolis, MN : Langdon Street, 2013. Print.
Throughout the world, humans drink 5.2 billion gallons of water and eat 21 billion pounds of food each day.
There are 7.5011 billion people on earth
Based on rough averages of water at .5-1 gallon (.75 gallons) x 7.5011 billion = 5.626 billion gallons of water and 7,605 metric tons of food produced per minute = 24.143 billion pounds of food per day.
Worldwide, cows drink 45 billion gallons of water and eat 135 billion pounds of food each day.
Based on rough averages of 30 gallons of water & 100 lbs. of food per day x
of cows 1.468 billion cows
We are currently growing enough food to feed 10 billion people.
Holt-Giménez, Eric. "We Already Grow Enough Food for 10 Billion People...and Still Can't End Hunger”. Common Dreams: Breaking News & Views for the Progressive Community. May 2012
Worldwide, at least 50% of grain is fed to livestock.
"Executive Summary: Feed Supply". Food and Agriculture Organization of the United Nations. (New)
"Did you know? U.S. and Wisconsin soybean facts". Wisconsin Soybean Marketing Board
82% of starving children live in countries where food is fed to animals, and the animals are eaten by western countries.
"Improving Child Nutrition: The achievable imperative for global progress". UNICEF. April 2013
"Livestock production index". The World Bank
15x more protein on any given area of land with plants, rather than cows.
Soybeans can be produced at 52. 5 bushels per acre x 60 lbs. per bushel = 3,150 dry soybeans per acre
Soybeans protein content (dry) is 163.44 grams per pound
The protein content per acre of soybeans is 163.44 g x 3,150 lb. = 514,836 g per acre
Beef can be produced at 205 pounds per acre
Beef protein content (raw) is 95.34 grams per pound
The protein content per acre of beef is 95.34 g x 205 lb. = 19,544.7 g per acre
The average American consumes 209 pounds of meat per year.
"Kings of the Carnivores. Vegetarians should look away". The Economist. April 2012
Barnard, M.D, Neal. "Do We Eat Too Much Meat?" The Huffington Post Blog. January 2011
Dairy consumption may lead to breast lumps.
Hicks, Cheryl. "Give up dairy products to beat cancer". The Telegraph. June 2014
Dairy may “give guys man-boobs”
Davidson, Garry. "Milk & Dairy For Guys With an Boobs". Chest Sculpting. August 2016
World Population grows 228,000+ people everyday.
"Current World Population". Worldometers (New)
"Visualizations of population growth". The Population Institute
Land required to feed 1 person for 1 year:
Vegan: 1/6th acre
Vegetarian: 3x as much as a vegan
Meat Eater: 18x as much as a vegan [xvii]
Robbins, John. Diet for a New America, StillPoint Publishing, 1987, p. 352
1.5 acres can produce 37,000 pounds of plant-based food.
1.5 acres can produce 375 pounds of beef.
Oppenlander, Richard A. Food Choice and Sustainability: Why Buying Local, Eating Less Meat, and Taking Baby Steps Won’t Work. Minneapolis, MN : Langdon Street, 2013. Print.
"Direct Seeded Vegetable Crop Chart". Johnny's Selected Seeds
A person who follows a vegan diet produces the equivalent of 50% less carbon dioxide, uses 1/11th oil, 1/13th water, and 1/18th land compared to a meat-lover for their food. [xx]
"The carbon foodprint of five diets compared". Shrink That Footprint
"Facts on Animal Farming and the Environment". One Green Planet.
"Vegetarianism and the Environment. Why going meatless is important". Vegetarian Guide
Each day, a person who eats a vegan diet saves 1,100 gallons of water, 45 pounds of grain, 30 sq ft of forested land, 20 lbs CO2 equivalent, and one animal’s life. [xiv]
"Meat Eater's Guide to Climate Change and Health". Environmental Working Group. 2011
"How much have you saved?" The Vegan Calculator (New)
Ogden, Lillie. "The Environmental Impact of a Meat-Based Diet". Vegetarian Times. (New)
Oppenlander, Richard A. Food choice and Sustainability: Why Buying Local, Eating Less Meat, and Taking Baby Steps Won’t Work. Minneapolis, MN : Langdon Street, 2013. Print.
Further reading on US food disparagement law
Further reading on Animal Enterprise Terrorism Act (AETA)
"S. 3880 (109th): Animal Enterprise Terrorism Act". govtrack
The problem with the Allan Savory's grazing approach.
Wuerthner, George. "Allan Savory: Myth and Reality". The Wildlife News. November 2013
ADDITIONAL NOTES:
[i] NOTE: In 2013 the UN-FAO lowered livestock’s GHG emissions to 14.5%.
There are many other factors to consider in terms of level of concern we should have regarding the role of food choice in climate change, global depletion in general, and certain applicable time lines as represented (or misrepresented) by the United Nations or any other governing or research institution. In particular:
1 does not represent the entire life cycle analysis (LCA) or supply chain of livestock products, notably omitting carbon dioxide production in respiration (on average 4.8 tons CO2 e/year/cow, 2.3 CO2 e/year/pig, etc.), provides no consideration for increased indirect radiative effects of methane on atmospheric aerosols and particulate capture related to smog (Shindell et al. 2009), and manages land use changes (LUC) with admitted “uncertainty” and under-counting/reporting
2 ultimately defers to a separate category for reporting of greenhouse gas emissions related to “deforestation” (20% of global GHG emissions per UN-REDD), of which livestock and feed crops play a significant role, needing to be added to direct emissions (80% of Amazonian rainforest deforestation and degradation, and destruction of Cerrado savanna since 1970 has been due to expansion for cattle, with another 10% loss due to planting crops to feed them and other livestock)
3 the global warming potential (GWP) for methane used in this report was from IPCC 2007, which was 21 at 100 years. However, the GWP of methane is actually 86 GWP at 20 years
4 the report gave no consideration to carbon sequestration potential lost on land now used for livestock and feed production, which should have been considered as emissions (45% of the land mass on Earth now used by livestock and crops to feed them–International Livestock Research Institute)
5 Consideration should be given to the fact that the lead authors have potential bias in this report; Pierre Gerber is the Livestock Policy Officer of the FAO and Henning Steinfeld is Chief, Livestock Information of the Livestock Sector Policy Branch of the FAO. There is little doubt why obvious omissions were therefore seen in their conclusions presented: “The global livestock sector is faced with a three-fold challenge: increasing production to meet demand, adapting to a changing and increasingly variable economic and natural environment and, lastly, improving its environmental performance.“
This FAO report failed to represent urgency in regard to climate change and reductions of greenhouse gas emissions, performed no analysis of alternatives, and failed to present risks versus benefits of raising livestock on a global scale.
1 there was no consideration of the effects of raising livestock on continued warming, acidification, deoxygenation and therefore diminished climate regulatory mechanisms of our oceans or time lines related to potential detrimental effects on the oxygen-nitrogen-carbon dioxide cycling capacities.
2 the report gave no account for anthropogenic greenhouse gases generated by agricultural systems related to extraction or raising and eating fish–fuel, refrigeration, packaging, processing, transportation, etc. for both wild caught operations as well as those pertaining to aquaculture/aquaponics/aeroponics, which would thereby provide a more accurate and complete agricultural portrait related to our food choices making it easier for policy makers and consumers to interpret the data and findings
3 there is no discussion, in an overview sense, to provide clarity regarding the component this happens to represent in livestock’s role, or food choice for that matter, in our current state of un-sustainability and the interrelated issues we face–freshwater scarcity, collapse of sea life oceanic ecosystems, unprecedented extinctions and loss of biodiversity, food security and agricultural land use inefficiencies, implications in human health and disease, rising health care costs and loss of productivity, economic risk factors, questions of social justice and implications regarding future generations, etc. (many of these issues are irreversible in our lifetime)–all part of the task of basic but thorough environmental scientific assessment, perhaps beyond the scope of livestock researchers/proponents for this one report, but the critical connection and relevance are vital should have been mentioned, nevertheless.It is quite clear by this report, which presents a filtered and quite limited view of the role of livestock in anthropogenic greenhouse gas emissions and global depletion, that our team should focus our attention on whythere is suppression of information, lack of clarity, or elucidation of facts by our leaders related to the overarching problem of animal based agriculture as a component of food choice–and then how to swiftly correct this. Global governmental institutions such as the United Nations and its FAO should examine all the facts and present them accordingly as they interrelate. Then, they should be able to call for the frank elimination (or comprehensive “replacement”) of imminent threats to our survival such as food choices and agricultural systems that are disease promoting, ecologically unsustainable, and which condone massive unnecessary slaughtering–rather than calling for their perpetuation.
[.i] Some have challenged that the 18% of GHG emissions from animal ag cannot be compared to the 13% of GHG for transportation emissions because it does not take into consideration the full lifecycle analysis of the transportation industry. We have made it clear in the film that 13% of GHG emissions only accounts for the exhaust from the worlds vehicles.
[ii] Although there are Cornell studies citing the water consumption of the US livestock industry at over 66 trillion gallons every year, we decided to go with a much more conservative figure of 34 trillion gallons based off the 2005 USGS figures putting the US total consumptive water use at 76 trillion gallons annually (non-consumptive is for thermoelectric and hydroelectric use that is typically returned directly back to its source immediately). The USDA says that agriculture is responsible for 80-90 percent of US water consumption and growing the feed crops for livestock consumes 56% of that water, bringing the total water consumption of the livestock industry to 34 trillion gallons.
[iii] 1 burger = 2 months showering: based on taking a 4-minute daily shower with a 2.5 gpm shower head.
[iv] “A typical five-acre hog waste lagoon releases 15-30 tons of ammonia into the air annually. Approximately half of the ammonia rises as a gas and generally falls to forests, fields, or open water within 50 miles, either in rain or fog. The rest is transformed into dry particles that travel up to 250 miles.
Ammonia is the most potent form of nitrogen that triggers algae blooms and causes fish kills in coastal waters. The North Carolina Division of Water Quality estimates that hog factories constitute the largest source of airborne ammonia in North Carolina, more than cattle, chickens, and turkeys combined. In 1995, Hans Paerl, a marine ecologist from the University of North Carolina, reported that airborne ammonia had risen 25% each year since 1991 in Morehead City, 90 miles downwind of the hog belt.”
[v] -Dairy Cows, 120 lbs. of waste per day x 9.32 million dairy cows
-Cows, 63 lbs. of waste per day x 83.68 million cows
-Calves, 30 lbs. of waste per day x 34.3 million calves
-Pigs, 14 lbs. of waste per day x 74 million pigs
-Sheep and Goats, 5 lbs. of waste per day x 7.84 million sheep and goats
-Turkeys, .87 lbs. of waster per day x 77 million turkeys
-Broiler Chickens, .50 lbs. of waste per day x 1.74 billion broiler chickens
-Laying Hens, .25 lbs. of waster per day x 350.7 million laying hens
*pigs are raised twice per year, (a total of 148.3 million per year) so on any given day in the United States there are about 74 million pigs.
*turkeys are raised three times per year (a total of 233 million per year) so on any given day in the United States there are 77 million turkeys.
*broiler chickens are raised 5 times per year, (a total of 8.69 billion per year) so any given day there are1.74 billion broiler chickens.
Dairy Cows produce (120 lbs. x 9.32 m.) = 1.1184 billion lbs.
Cows produce (63 lbs. x 83.68 m.) = 5.27184 billion lbs.
Calves produce (30 lbs. x 34.3 m.) = 1.029 billion lbs.
Pigs produce (14 lbs. x 74.0 m.) = 1.036 billion lbs.
Sheep and Goats produce (5 lbs. x 7.84 m.) = 39.2 million lbs.
Turkeys produce (.87 lbs. x 77.0 m.) = 66.99 million lbs.
Broiler Chickens produce (.5 x 1.74 b.) = 870 million lbs.
Laying Hens produce (.25 x 350.7 m.) = 87.675 million lbs.
*Total manure produced in one day is 9.519105 billion lbs.
*Total manure produced in one year is 3.475 trillion lbs.
*This is the equivalent of over 6.611 million lbs. per minute. (This does not include any animal raised outside of USDA Jurisdiction, backyards or fish raised for aquaculture)
[vi] Enough waste to cover, etc: based on 1 pound of waste per 1 square foot of land
“Animal farms produce as much manure as small and medium sized cities. A farm with 2500 dairy cattle is similar in waste load to a city of 411,000 people.”
On a 1000-pound live weight basis, each of these animals produces more waste than a human. A CAFO with 1000 animal units of turkeys produces a waste load comparable to a city of 87,700 people. A dairy CAFO with 1000 animal units is equivalent to a city of 164,500 people. The important difference lies in the fact that human waste is treated before discharge into the environment, but animal waste is either not treated at all or minimally treated by virtue of the storage methods used before disposal.” http://nepis.epa.gov/Exe/ZyPURL.cgi?Dockey=901V0100.txt
[vii] Additionally – Oppenlander says 1-2 trillion fish extracted (inc. “bycatch,”) from our oceans each year (“by fishing methods such as trawling, purse seine, long lines, explosives, and other techniques that are damaging ecosystems”) http://comfortablyunaware.com/blog/biodiversity-and-food-choice-a-clarification/
[viii] The figures for by-kill rates can be as high as 20lbs of untargeted species trapped for every pound of targeted animals killed.
[ix] “The USDA currently forecasts 2013/14 palm oil production…total area devoted to oil palm plantings is estimated at a record 10.8 million hectares.” [26.7 million acres]
[x] “[Dorothy Stang’s] death prompted Amazon activists – more than 1,000 of whom have been murdered in the last 20 years – to demand Brazil’s government crack down on the illegal seizure and clearance of the rainforest to graze cattle, raise soy crops, and harvest timber.”
“More than 1,100 activists, small farmers, judges, priests and other rural workers have been killed in land disputes in the last two decades.”
[xi] A single cow can produce between 66-132 gallons of methane a day. The average US vehicle gas tank can hold about 16 gallons of gas.
[xii] “The US meat industry produced some 1.4 billion tons of waste in 1997— five tons of animal waste for every US citizen. (USDA)”http://www.worldwatch.org/fire-grill-mouthwatering-red-white-and-green-july-4th
[xiv] The average person in the U.S. uses 405,000 gallons of freshwater per year (combination of the subfractions which comprise 206 pounds of meat per year– divided between 46 pounds of pig, 58 pounds of cow, 102 pounds of chicken and turkey in addition to 248 eggs and 616 pounds of dairy products), which equates to saving 1,100 gallons of water each day.
– 45lbs of grain saved per day: Grain: multiply ounces of each meat consumed daily per person by the feed conversion factor for each animal.
– It is estimated that 80,000 acres of rainforest are cleared each day with an additional 80,000 degraded, with 70-91% of that degradation for the livestock industry.
– CO2 based of feed conversion ratios and the average US meat consumption of 209lbs per year, per person.
Beef is at 22-27 kg CO2 Eq per kg produced/consumed X 2.5 ounces/day=1.75 kgor 3.85 pounds
Cheese/milk is 13.5 kg per kg product X 2 pounds/day=12.15 kg or 12.5 pounds
Pork is 12 kg per kg product X 2 ounces/day=.68 kg or 1.5 pounds
Combination chicken and turkey is 7 kg per kg product X 4.48 ounces/day= .89 kg or 1.96 pounds minimally (using only chicken)
{turkey, for instance, is 11 kg per kg product}
Eggs are at 5 kg per kg product X 2/3 egg per day= (50 g/egg) .55 pounds
— which equals 20.36 pounds of CO2 Eq saved per day.
[xv] An important distinction must be made between water "use" and "consumption". Hydroelectric power is one of the largest "users" of water in the US, but actually consumes very little water. The water is used to power turbines or for cooling and is almost always returned to the source immediately. Agriculture is the largest "consumer" of water because it pulls water from the source and locks it up in products, not returning it to the source immediately, if ever.
[xvi] $414 billion of externalized costs breaks down to: $314 billion in health-care costs, $38 billion in subsides, $37 billion in environmental costs, $21 billion in cruelty costs, $4 billion in fishing-related costs. Learn more by reading Meatonomics, by David Robinson Simon.
[xvii] On average, one acre of land of any level of fertility will be able to produce 15 to 18 times more protein from plant based sources than from animal products. Additionally, using any agricultural database regionally, nationally, or internationally, one can calculate that on average between 10 times and 100 times (in weight) more plant foods (vegetables, fruit, grain/nuts) on one acre of land than from animal products raised on that same acre of land, regardless of the level of fertility of that particular acre of land, presuming it is the same acre used for either product, animal or plant based.
[xviii] Many organizations are studying humanity’s effect on soil degradation, erosion, and eventual desertification but not willing to emphasize the final connection of dots to animal agriculture. According to the UNCCD (United Nations Convention to Combat Desertification), nearly 20 million acres of arable land is lost each year due to desertification and the primary reasons are:
1. deforestation due to cultivation of crops and pasture
2. overgrazing from livestock (“eating away grasses and eroding topsoil with hooves”)
3. intensive farming stripping away nutrients in soil
http://www.un.org/en/events/desertificationday/background.shtml
Overgrazing by livestock is the principal land problem related to desertification as indicated in the article: http://www.ciesin.columbia.edu/docs/002-186/002-186.html And, according to the UNDDD: “Nearly 20% of the degrading land (globally) is cropland, and 20-25%, rangeland.” Understanding that over 70% of the global arable land used for agriculture is planted for crops grown for livestock, there is be ample support for the statement that “animal agriculture is the leading driver for approximately 1/3 of the land lost on earth due to desertification.” http://www.un.org/en/events/desertification_decade/whynow.shtml
[xix] Few prominent scientists will openly proclaim the connection of their research findings with the need to eliminate animal agriculture or promotion of fully plant based nutrition. This is an observation that spans all aspects of global depletion related to food choice, including the topic of loss of biodiversity and extinction of species.
The statement that animal agriculture is the primary driver of biodiversity loss and extinction of species is supported by many discussions and interviews with leading authors and scientists working for the Convention of Biodiversity and IUCN as well as publications regarding current biodiversity assessments as presented by Millennium Ecosystem Assessment, the IUCN Red List, and the Global Environmental and Biodiversity Outlook.
Most organizations that associate their work with species and ecosystem/biodiversity concerns as well as the scientific community as a whole believe that the six main threats to our oceans are climate change, overfishing, predator loss, pollution, destruction of habitat, and bycatch, (“bykill”).
(For instance: The Species Survival Commission of the World Conservation Union and the Convention on Biological Diversity).
As of August 2012, the 2004 Global Species Assessment was the most recent empirical data on global extinction rates, based on birds, mammals, and amphibians. According to an interview conducted by Dr. Oppenlander with Simon Stuart, PhD, chair of the International Union for Conservation of Nature Species Survival Commission:
“Habitat loss from grazing livestock and feed crops is far and away the most pervasive threat to terrestrial animal species, impacting 86 percent of all mammals, 88 percent of amphibians, and 86 percent of all birds. One in every eight birds, one in every three amphibians, and one in every four mammals is facing an extremely high risk of extinction in the near future. Overexploitation of wild animals for consumption remains a second major factor for extinction, such as can be seen in bushmeat trade in Africa and Southeast Asia and all hunting endeavors on land, globally.”
The Alliance for Global Conservation estimates 36 percent of all species on our planet are in danger of extinction.
Scientists have divided our planet into 825 terrestrial “ecoregions” (as well as 450 freshwater and a number of oceanic ecoregions), each defined by its own distinct set of animal and plant species, as well as climate. Of all these land ecoregions, almost half are reported by lead scientists (interviews/discussions) to have livestock as a current threat. The World Conservation Union reported in 2010 that “most of the world’s endangered or threatened species” on their Red List (which lists the species that are most endangered) are suffering habitat loss due to livestock—not due to agriculture but to livestock.
The Convention on Biological Diversity, held in Nagoya, Japan, in October 2010 agreed that none of their goals from 2002 for lessening the rate of biodiversity loss were met. The attendees confirmed that the main pressures for the rapid loss of species—habitat change, overexploitation, pollution, invasive species, and climate change—were all increasing in intensity.
Current biodiversity assessments (as presented by Millennium Ecosystem Assessment, the IUCN Red List, and the Global Environmental and Biodiversity Outlook) now generally agree that land use change, modification of river flow, freshwater pollution, and exploitation of marine environments are the most significant drivers of biodiversity change and loss of species. Because more than 50% of the land use changes on Earth are related to livestock (ILRI), 70 to 90% of freshwater pollution in western countries (particularly the U.S. and China) can be traced back to animal agriculture, minimally 14.5% of anthropogenic GHG emissions/climate change, and 100% of “exploitation of marine environments” is related to the global commercial fishing industry, it can be safely and confidently demonstrated that “the primary driver of global species’ extinctions and loss of biodiversity is animal agriculture.”
[xx] The amount of water, land and fuel used for differing diets varies greatly from the types of foods consumed, amount consumed and the geographical region where the food was raised. Taking into consideration that 1lb of beef requires upwards of 2500 gallons of water to produce compared to only 25 gallons for 1lb of wheat, the water footprint of a person consuming a high meat diet could be 100x greater than that of a person consuming only plant foods. The same applies for land and oil use. Many arid areas of the world can not support 1 cow per 2 acres and require 50+ acre per cow, compared to a crops such as potatoes that can produce 50,000lbs+ per acre. The energy/fuel inputs are similar. 1 calorie of beef can take 27x more energy to produce than soybeans.
xxi (New) As of 2016 the estimates of wild horses and burros has increased on the range to 67,027 and the amount of wild horses and burros in holding fcailities is more than 45,000. However the BLM considers the amount of wild horses and burros on the range too populated and will attempt to remove 40,000 to bring the level back to what is considered by the BLM the 'acceptable level'